

One number from Garmin's latest annual report should reset how most runners think about their training week: nearly 40% of Garmin users run between 6 and 10 miles per week. Only 3% exceed 31 miles.
Garmin just published its annual trends report, drawn from millions of activities logged in Garmin Connect throughout 2025. Distance, pace, weekly volume, recovery — and the most significant behavioral shift of the year. Here are the numbers.
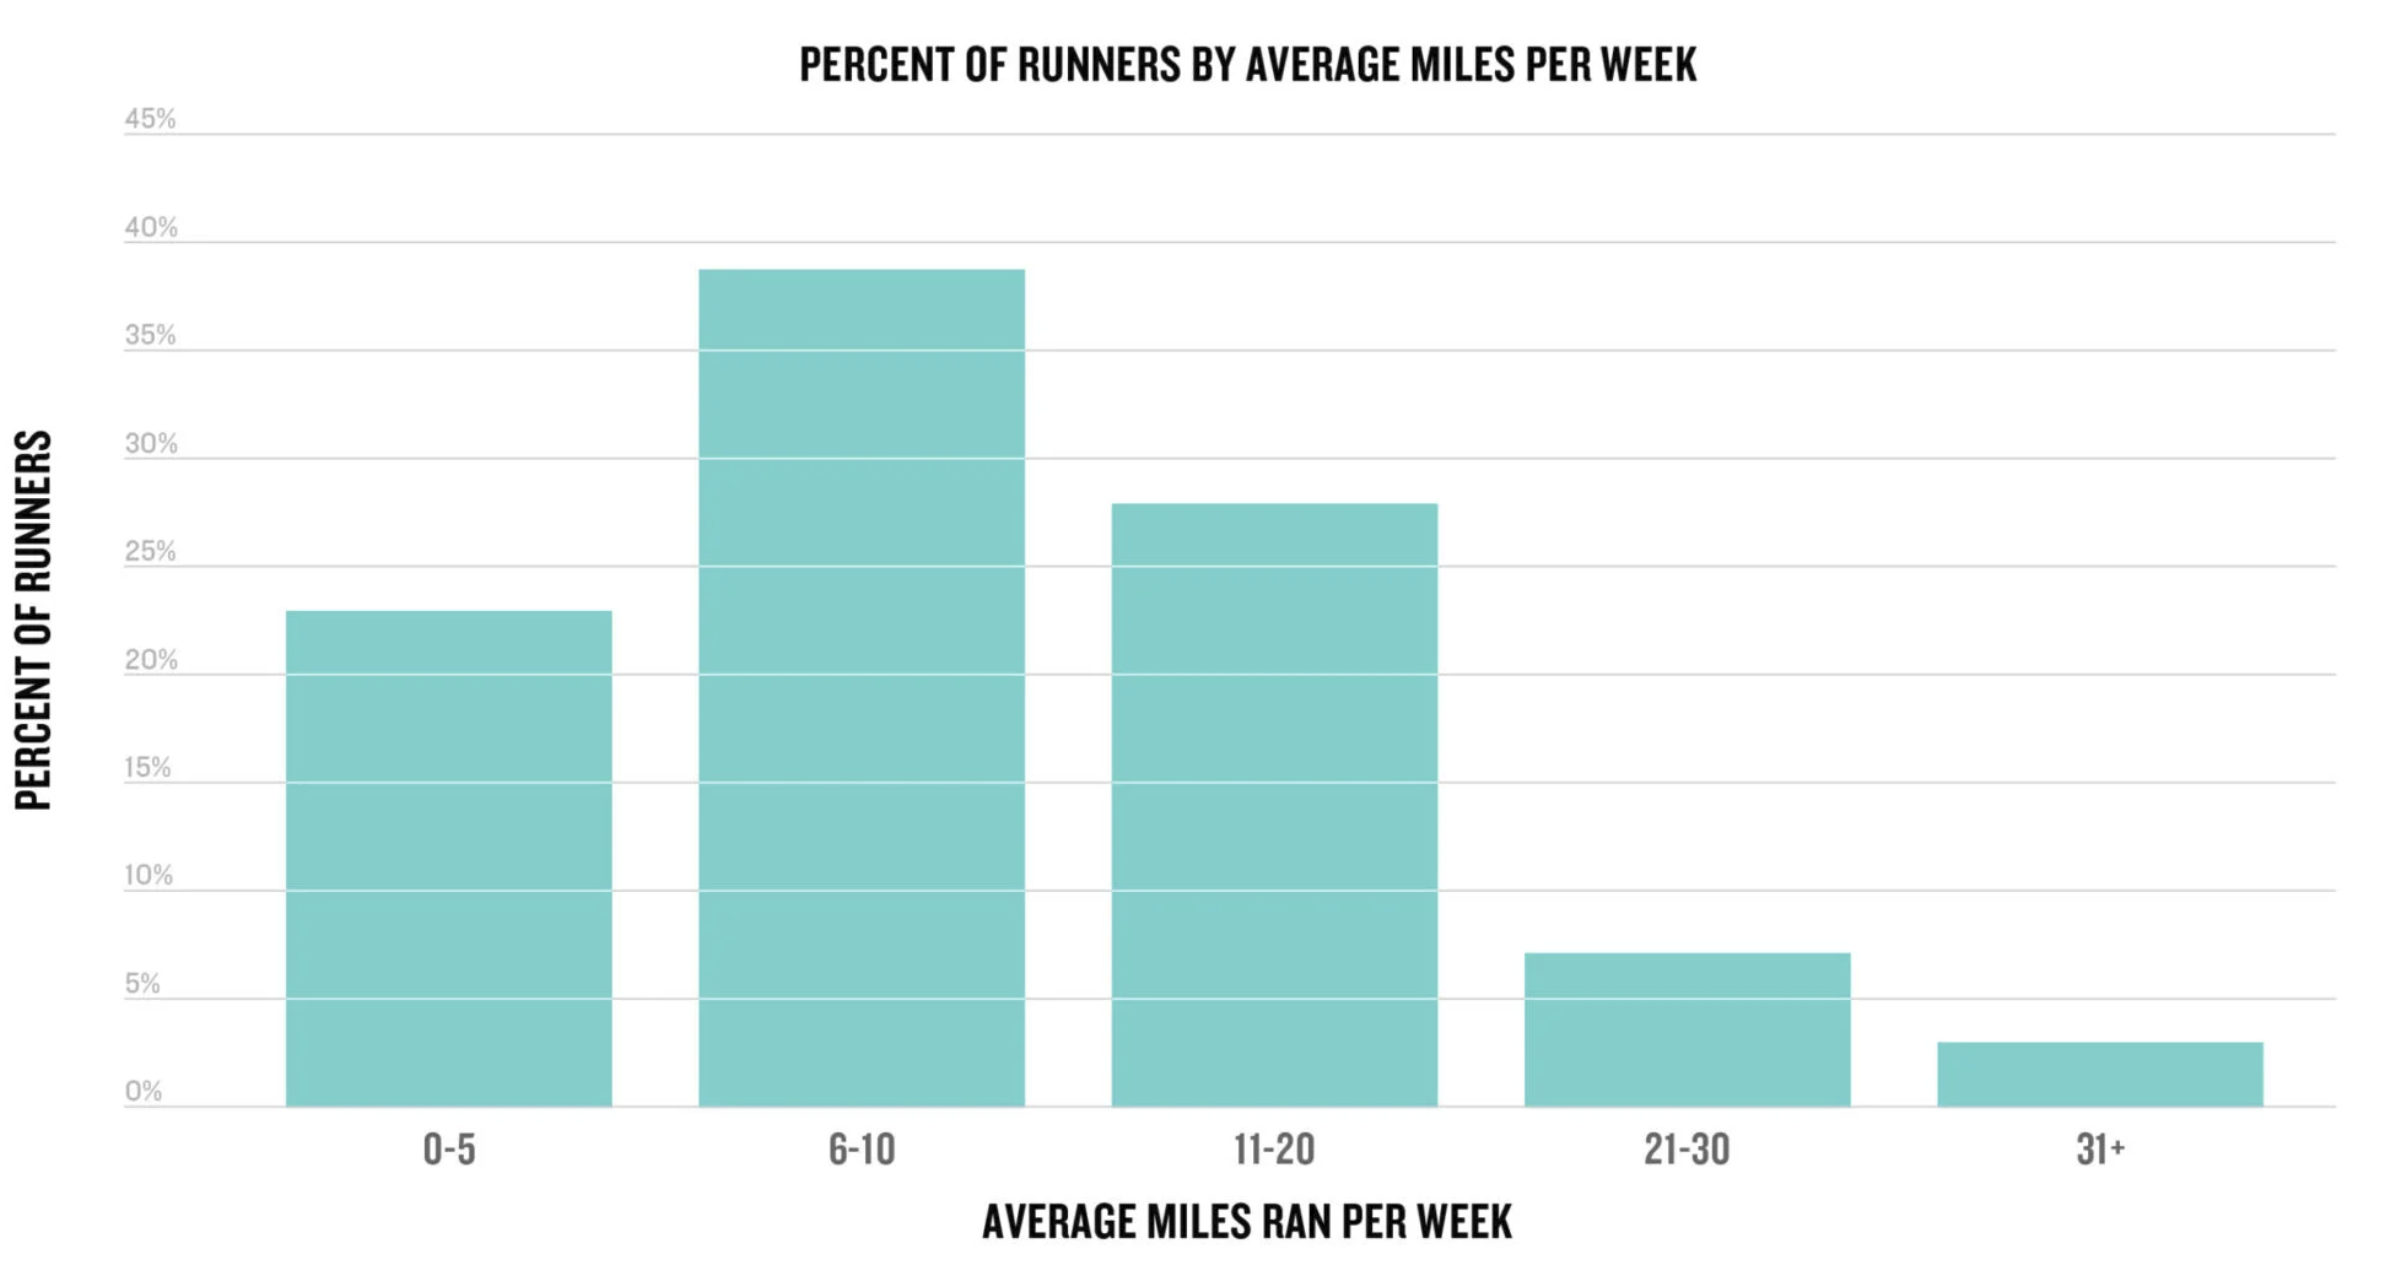
How much do most runners actually run per week?
The sweet spot is 6–10 miles per week, where nearly 38% of Garmin runners land. Another 27% run between 11 and 20 miles weekly. At the other end: only 7% exceed 21 miles per week, and just 3% go beyond 31.
Nearly 65% of Garmin runners log between 6 and 20 miles per week. If you're in that range, you're in the majority — and that's enough to keep improving.
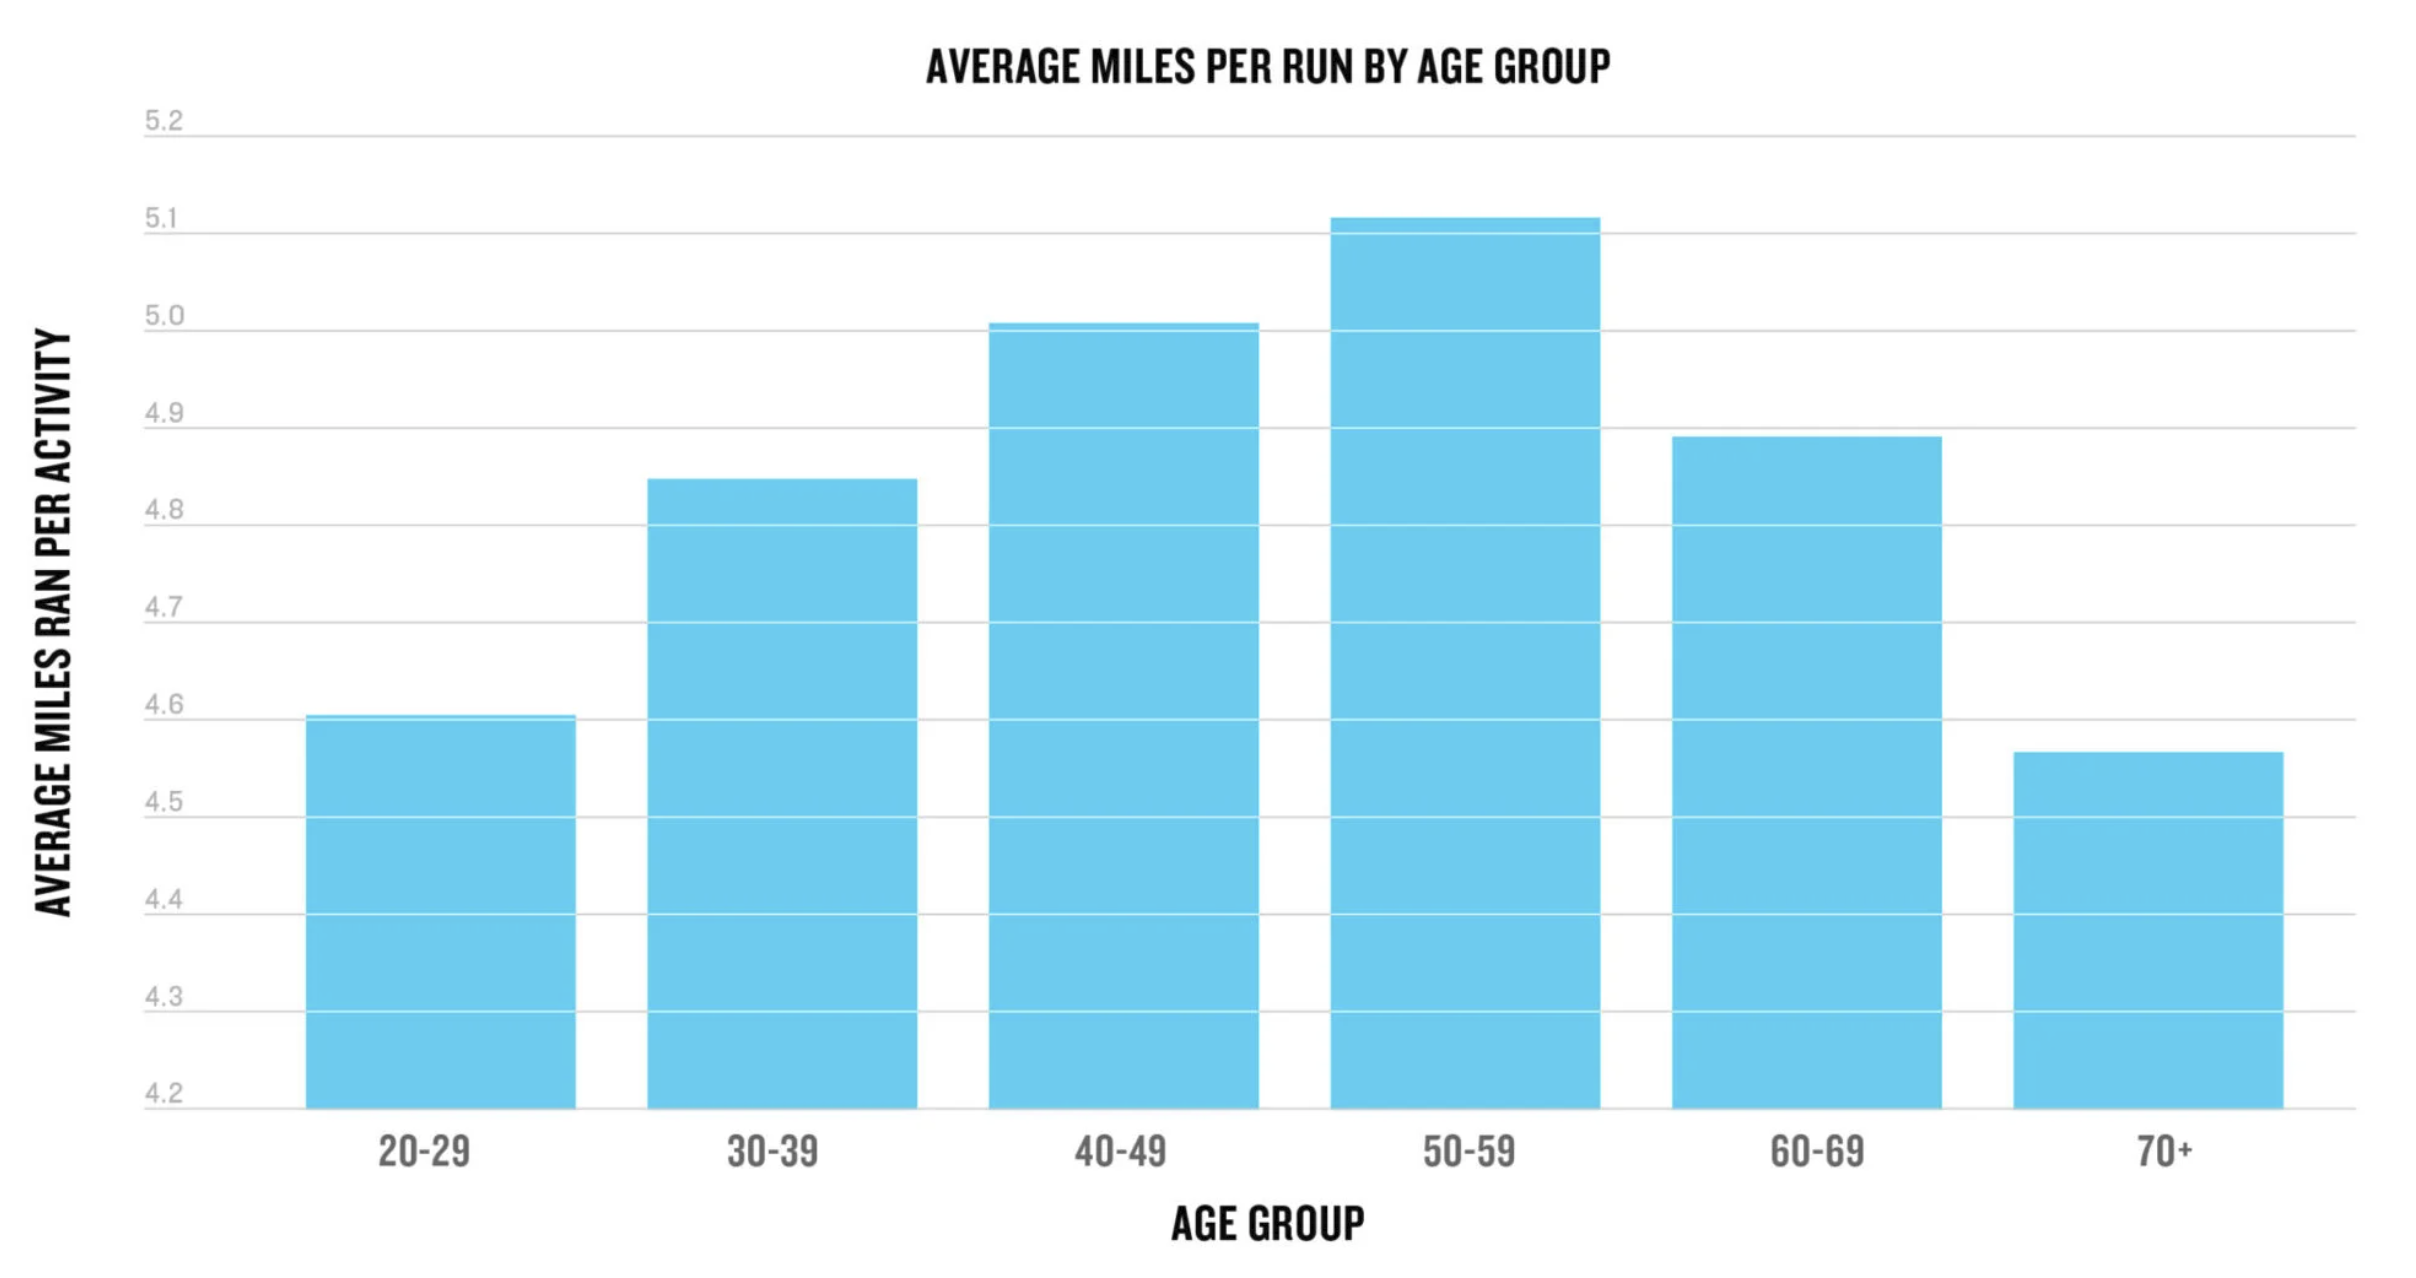
How far do runners go per run, by age group?
The global average run distance was 4.82 miles. The pattern across age groups is worth noting: distance per run increases steadily from the 20s through the 50s, then eases back slightly.
Runners aged 50–59 logged the longest average at 5.1 miles per run. Those in their 20s averaged 4.6 miles — the shortest of any group, though they run the fastest. Runners 70+ average 4.56 miles, nearly matching the youngest group. Experience translates into miles, not just years.
Average session duration tells a similar story: the 20–29 group averages 42.6 minutes per run, while everyone from 50 and up averages over 50 minutes. Older runners run fewer miles per hour — and spend more time doing it.
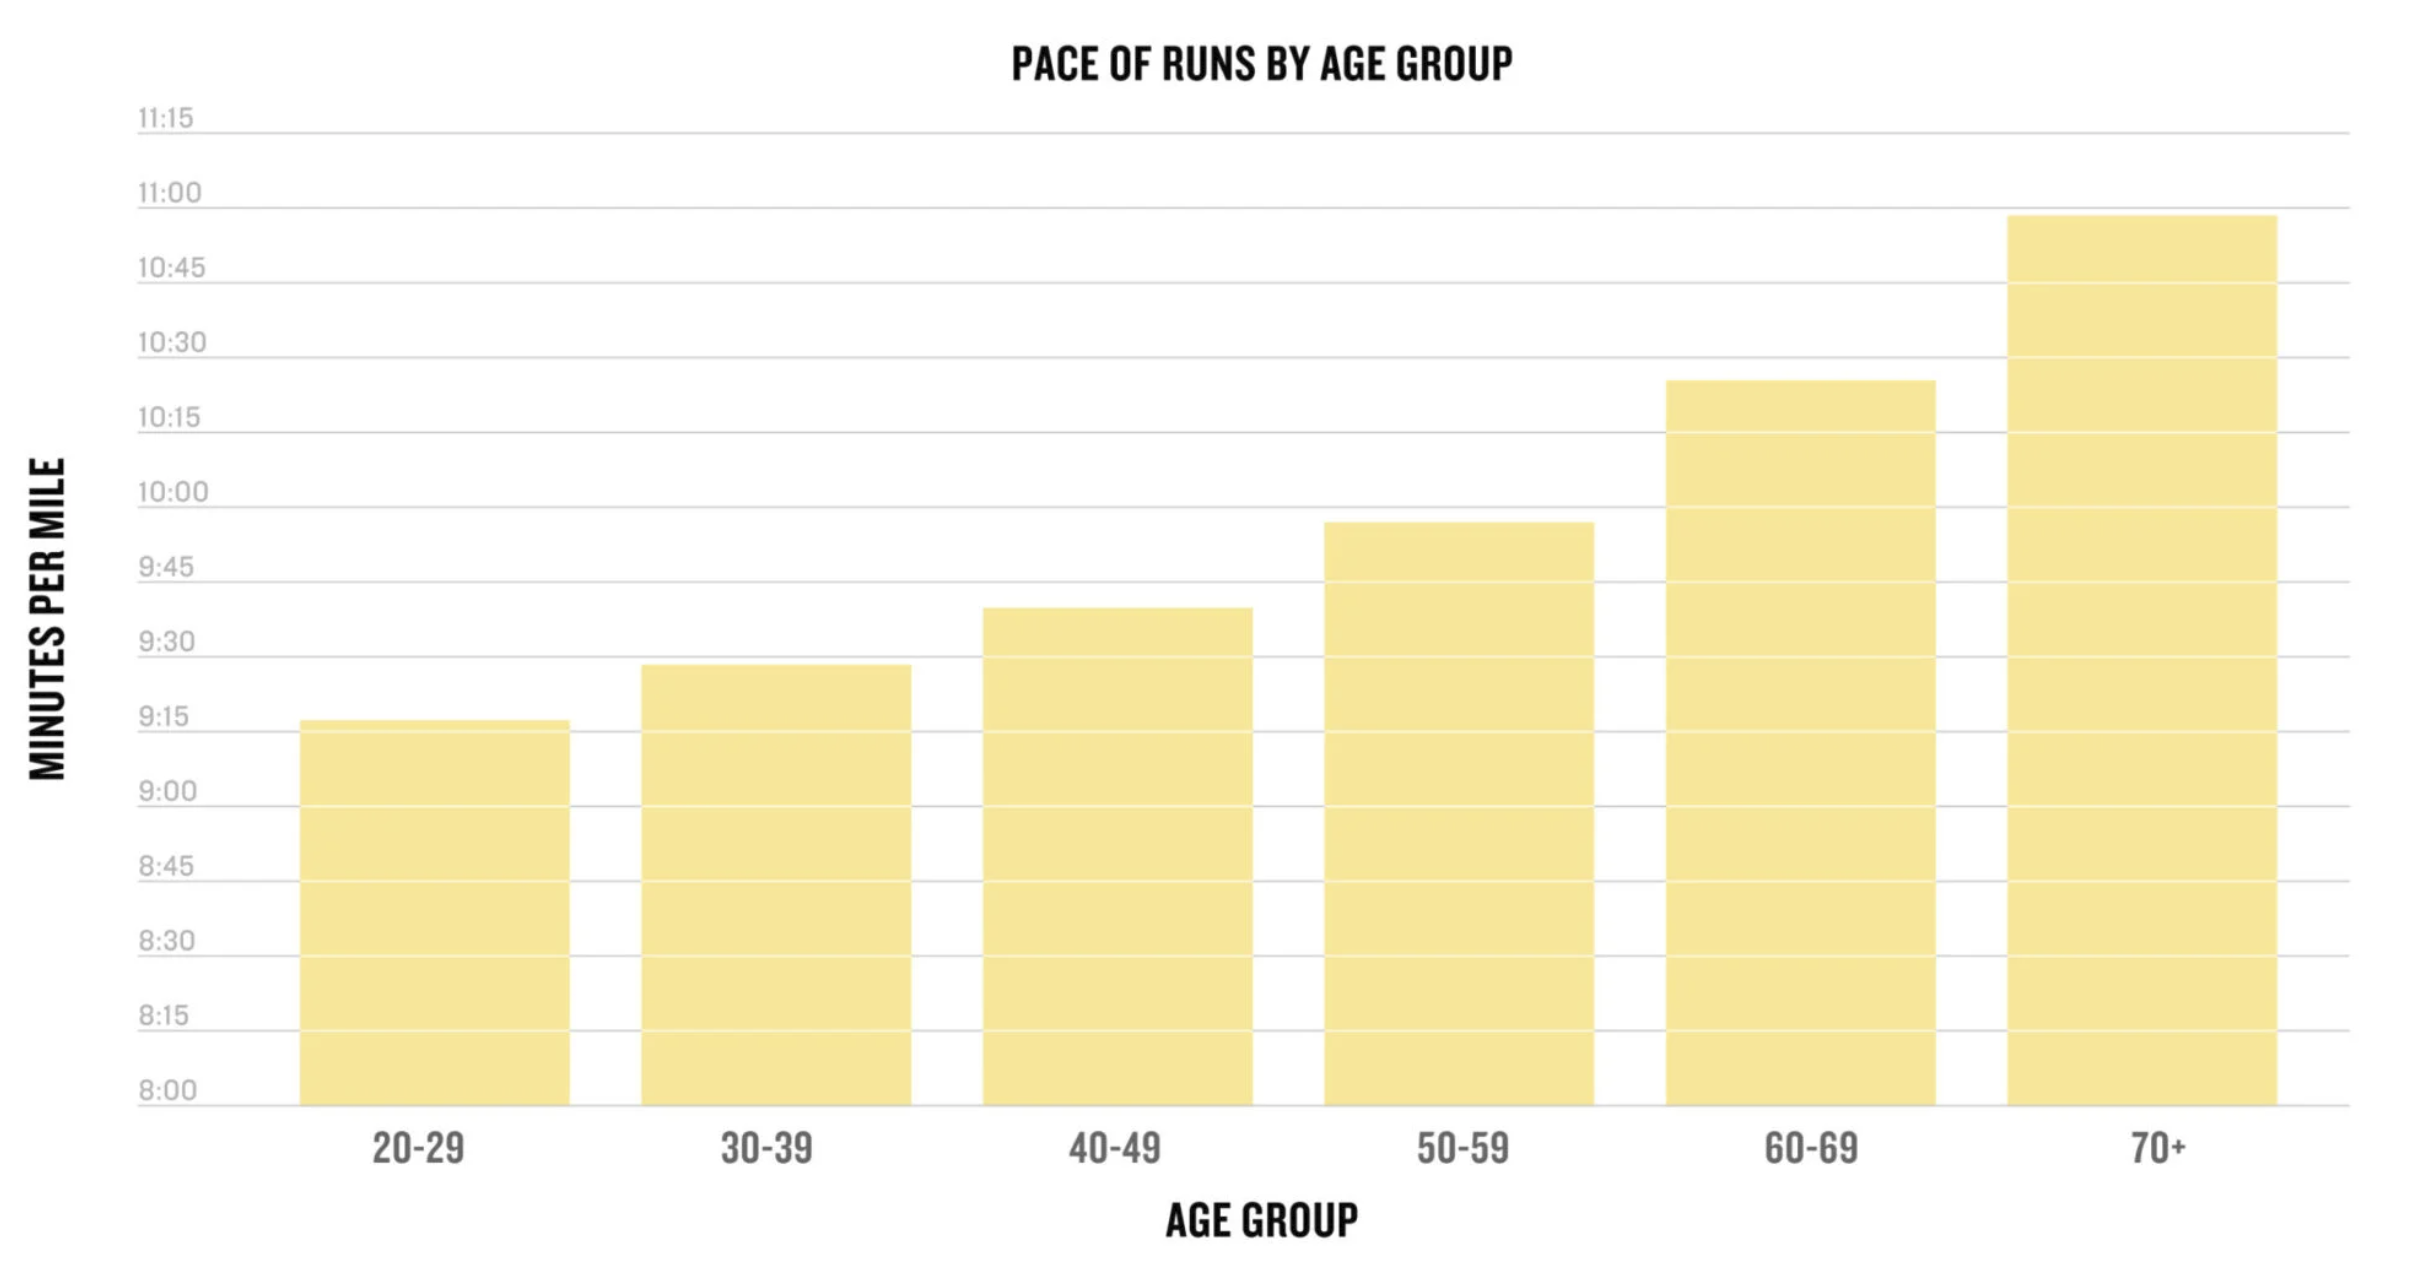
Pace by age group — and which countries run fastest
Global average pace was 9:21 min/mi for men and 10:11 min/mi for women. By age, pace slows steadily: from 9:16 min/mi for the 20–29 group all the way to 10:57 min/mi for those 70+.
The three fastest countries in the report: Ireland (9:09 min/mi), Portugal (9:12 min/mi), and Italy (9:13 min/mi). Finishing a 10k at Ireland's average pace takes 56 minutes. At the global men's average, around 58 minutes. The gap isn't enormous — and reflects climate, altitude, and running culture as much as fitness.
Who's running more than last year?
Running activity increased across all age groups from 2024 to 2025 — but not equally. The 30–39 group led with a ~5.3% increase in average activities per user. The 20–29 group followed at ~4.3%. Older groups also grew: 60–69 at ~2.5%, 70+ at ~1.8%, with 40–49 and 50–59 showing the smallest gains at around 1.4–1.5%.
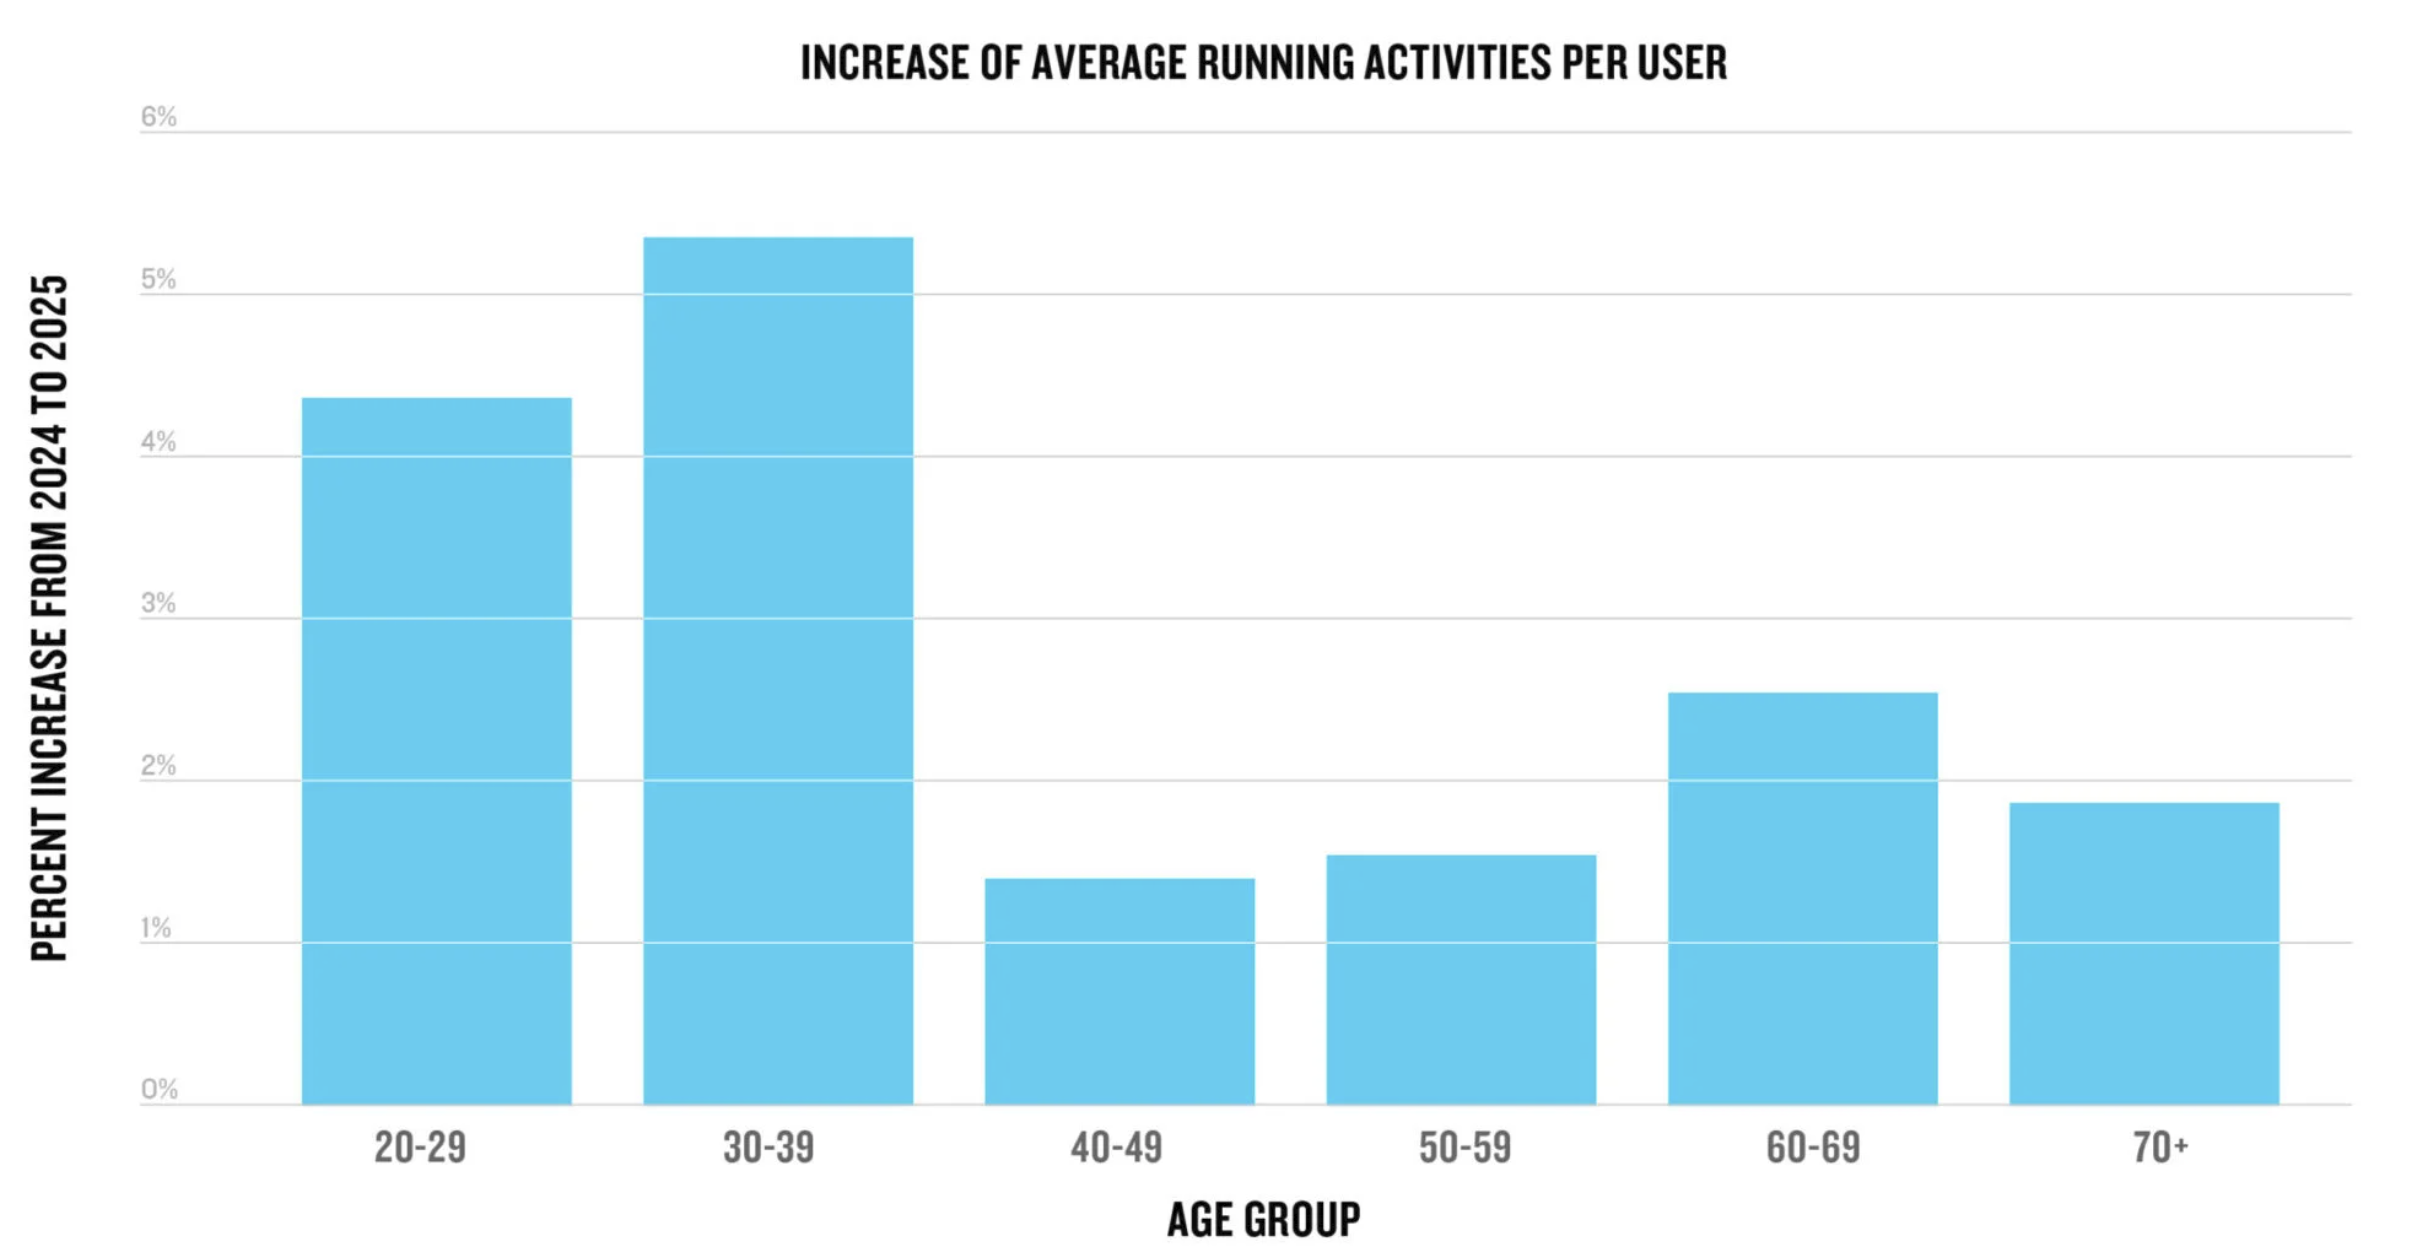
The data shows that running isn't just growing among younger users. Runners over 60 are also logging more sessions year over year.
The biggest shift of the year wasn't running more
The most revealing finding in the report has nothing to do with distance or pace: between 2024 and 2025, the number of runners who logged a run and a strength training session in the same week grew by 23%.
The science backs up why this matters: strength training improves running economy, reduces injury risk, and raises performance in longer distances. What Garmin's data shows is that this evidence has moved from research papers into actual training behavior — millions of runners are doing it, not just reading about it.
And the recovery data explains why that habit changes more than your race time.
What the data says about sleep and heart health
Sleep: Runners slept better than non-runners. Average sleep score: 73–74 for runners vs. 70 for non-runners. Sleep is where the body actually adapts to training — not during the run itself.
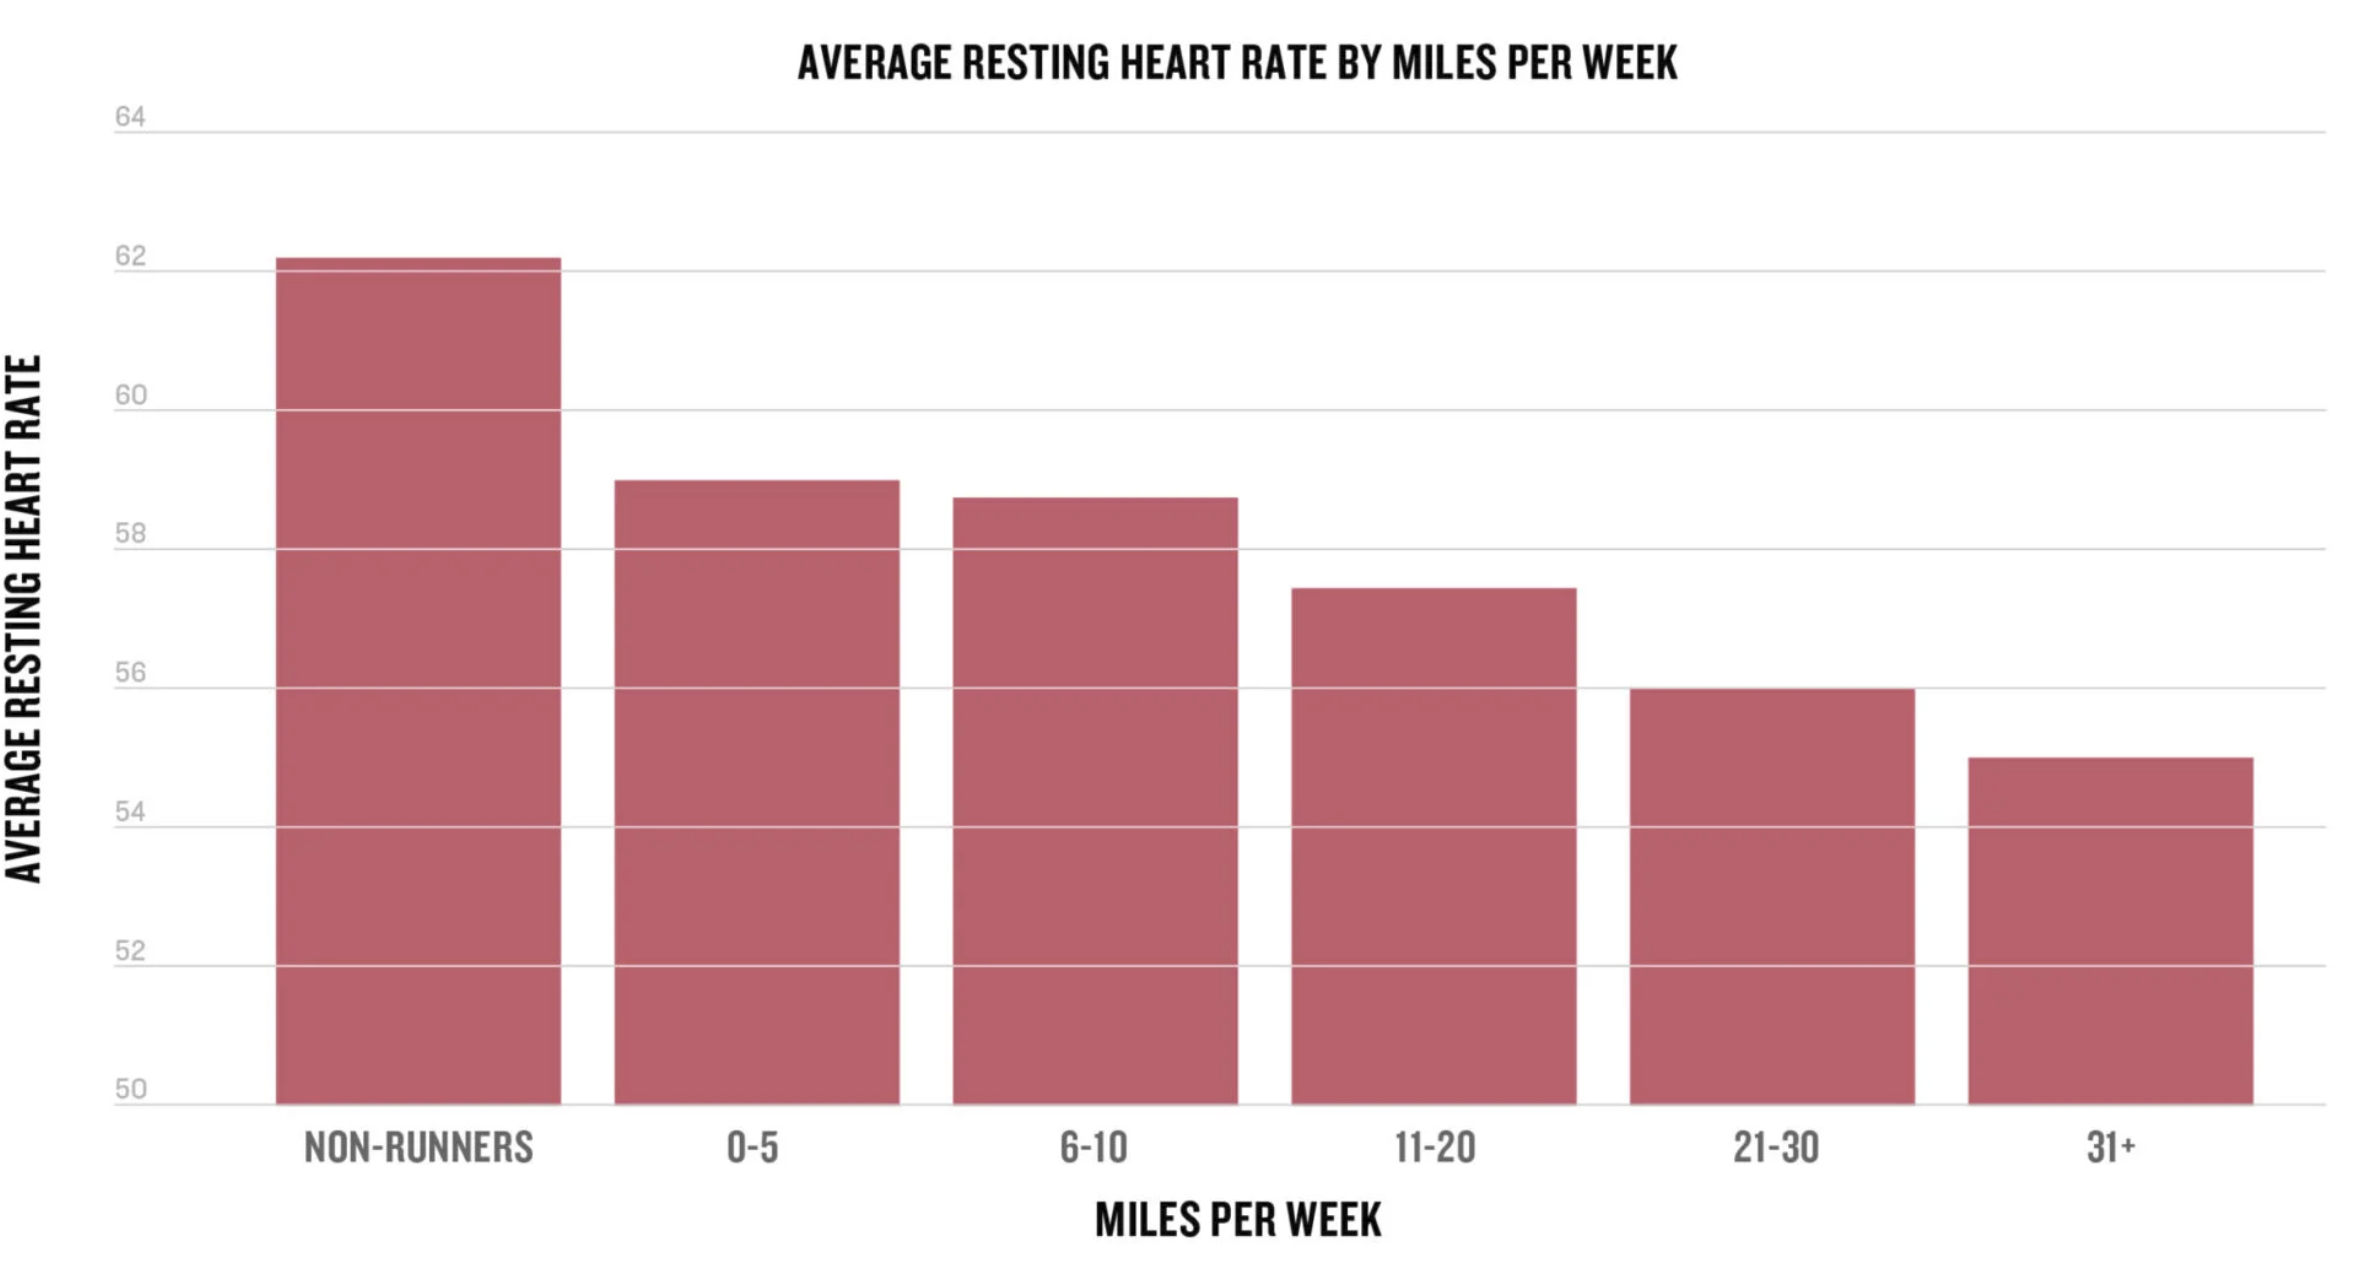
Resting heart rate: The curve is clear. Non-runners average 62 bpm. At 0–5 miles per week: 59 bpm. At 6–10 miles: 58.7 bpm. At 11–20 miles: 57.5 bpm. At 21–30 miles: 56 bpm. At 31+ miles: 55 bpm. Every additional tier of weekly mileage drops the number. Seven beats separate the non-runner from the high-volume runner — accumulated week by week.
The most popular training goal: the half marathon
The most-used Garmin Coach training plan in 2025 was for the half marathon. Not the full marathon, not the 10k. The 13.1 miles.
It makes sense: it's the distance where training becomes serious without taking over your life. It demands consistency and a real preparation cycle — but stays compatible with work, family, and everything else that fills a week.
One number to close with
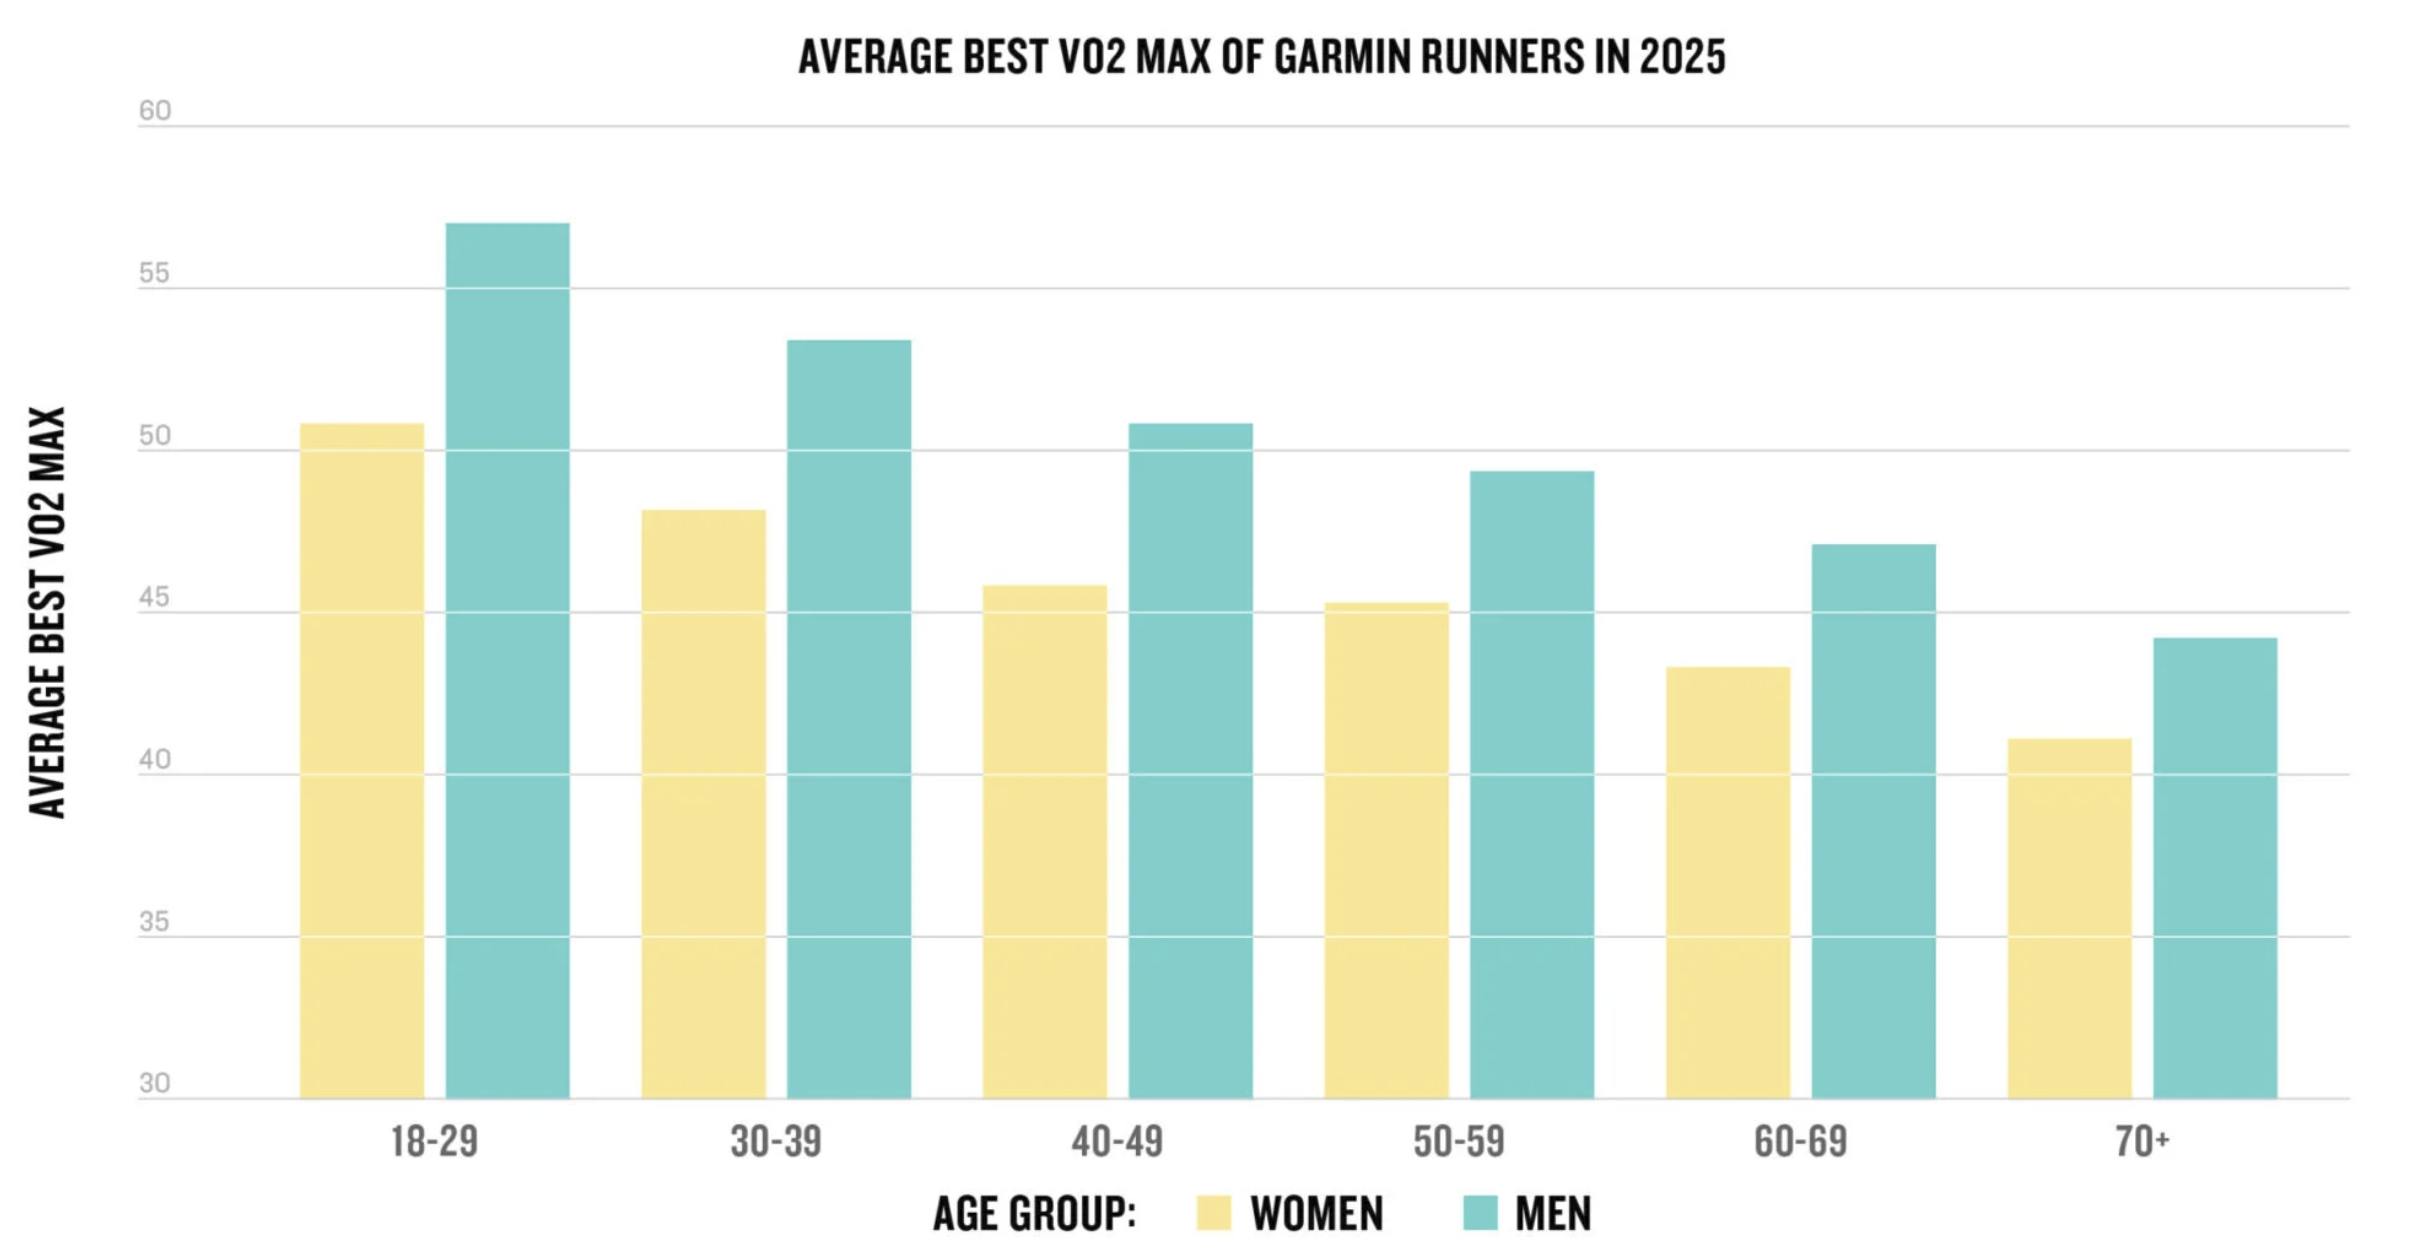
The average VO2 max across all Garmin runners was 50. That's not an elite number. It's the number of someone who runs consistently, sleeps reasonably well, and is starting to add some strength work to their week.
Which part of this data looks like your training — and what would you change?
Sources: Garmin Global Running Data Report 2025 / Garmin Connect. Full report: Trends in Running — How Garmin Runners Hit Their Stride